Soup Spoon
The soup spoon takes the shape of the percentage of Chinese immigrants of all new immigrants to the United States every decade from 1880 to 2010. The dip in the spoon shows the effect of the Chinese Exclusion Act, enacted from 1882 to 1943, which banned all immigration of foreign born Chinese to the United States.

Background
This project focuses on the period during the Chinese Exclusion Act, which was the first federal law implemented to prevent a specific ethnic group from immigrating to the United States and set the precedent for later restrictions against immigration of other nationalities.
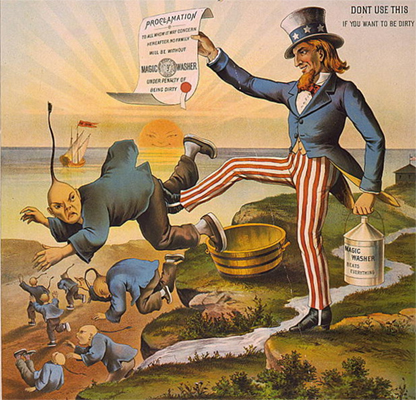
Despite being crucial to the construction of the First Transcontinental Railroad, Chinese immigrants were increasingly seen as racially inferior and an economic threat due to their willingness to work for low wages. In 1882, the passage of the Chinese Exclusion Act represented the outcome of years of racial hostility and anti-immigrant agitation by white Americans. The law would not be repealed until the end of 1943, over 60 years later, when China was seen as an ally against the Japanese in World War II.
However, the 1943 act still allowed only 105 Chinese immigrants per year. It was not until the Immigration Act of 1965, which abolished the quota system based on national origins, that large-scale Chinese immigration to the United States was allowed to begin again after a hiatus of over 80 years.
Design
The form of the spoon was based on a traditional Chinese soup spoon. However, the outer shape of the spoon was completely made algorithmically using data provided by the United States Census. When viewing the spoon in profile, the outer contour follows the approximate curve of the percentage of Chinese immigrants out of all new immigrants to the United States every decade from 1880 to 2010. An additional data point was added at 2015 to reflect more recent data.
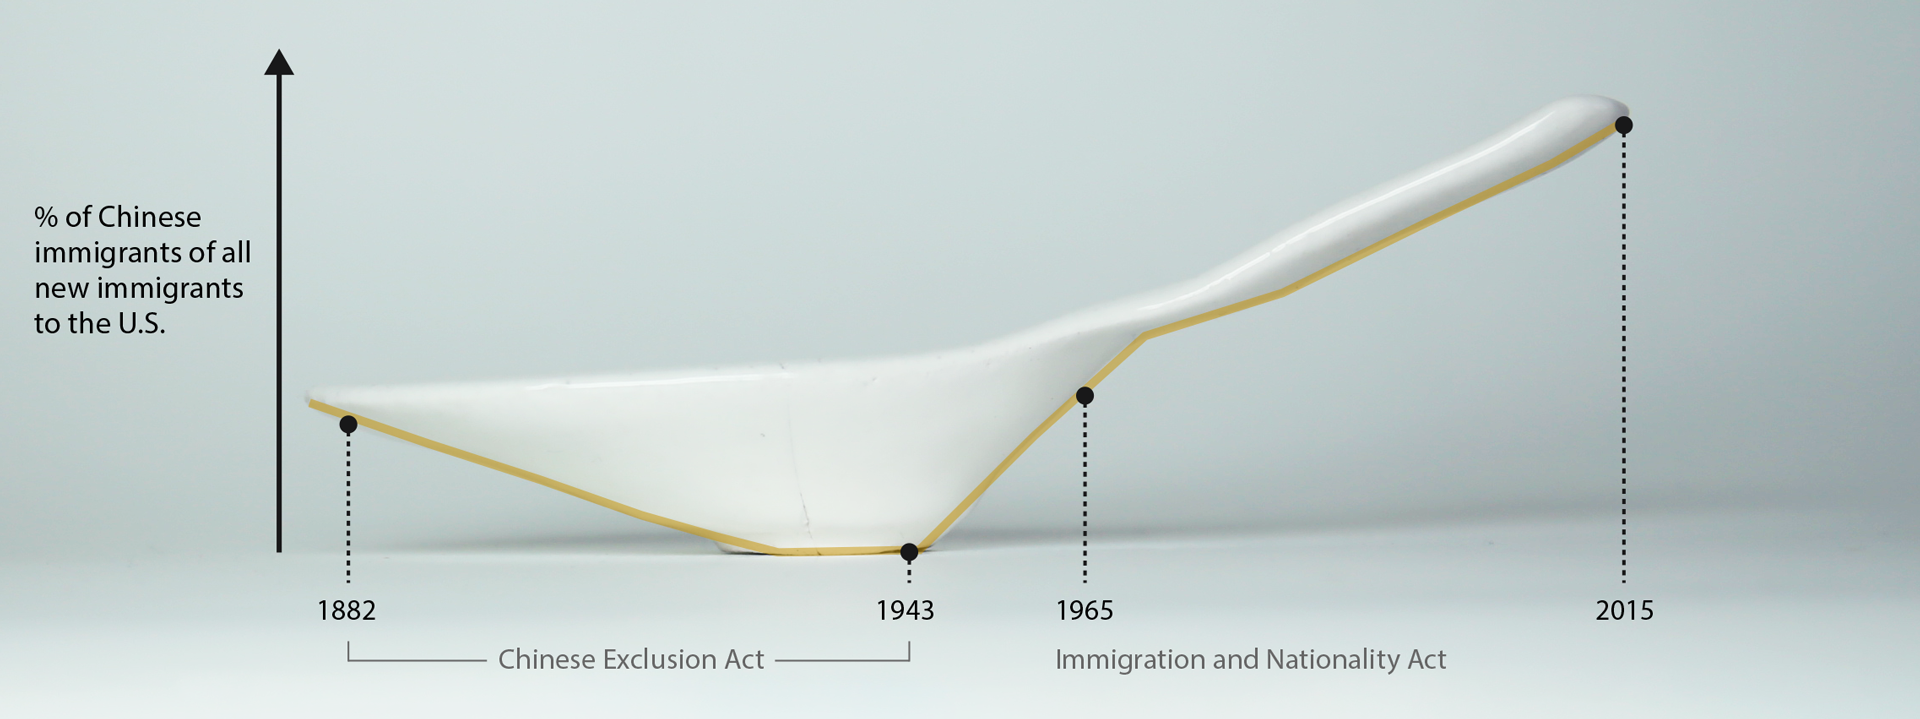
The left tip of the spoon begins in 1880, two years before the Chinese Exclusion Act, where Chinese immigrants represent 1.5% of all immigrants to the United States. By the early 20th century, Chinese immigrants represent only about 0.3% of all immigrants to the United States, representing the few Chinese merchants, students, and politicians who were special exemptions from the law. The handle of the spoon represents the years following the repeal of the exclusion law in 1943 where we see a steady increase in the percentage of Chinese immigrants that rise to the over 4% we see today.
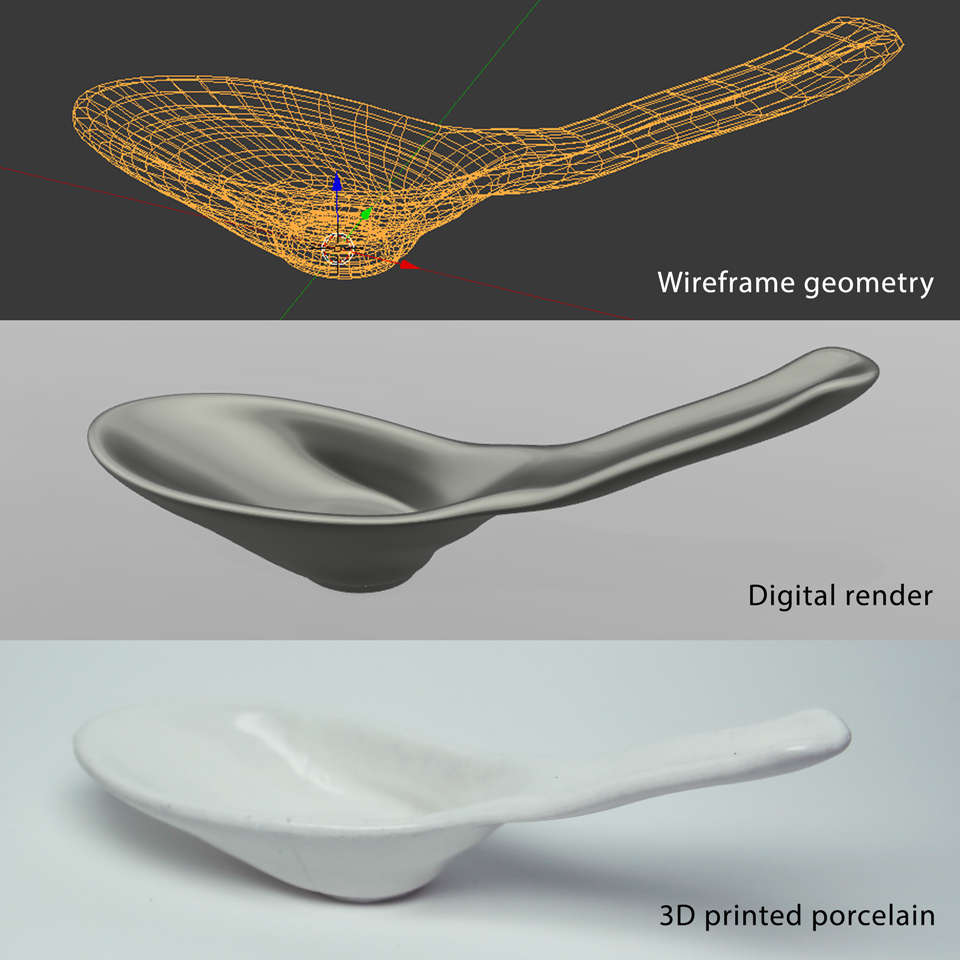
The model
The model was generated algorithmically using free and open source software: Python and Blender. Python was used to generate the geometry and Blender was used for post-processing, viewing, and exporting into a printable 3d model.
You can view the source code and instructions for how this model was created. You can also view the model in your browser
View additional pieces: