Plate

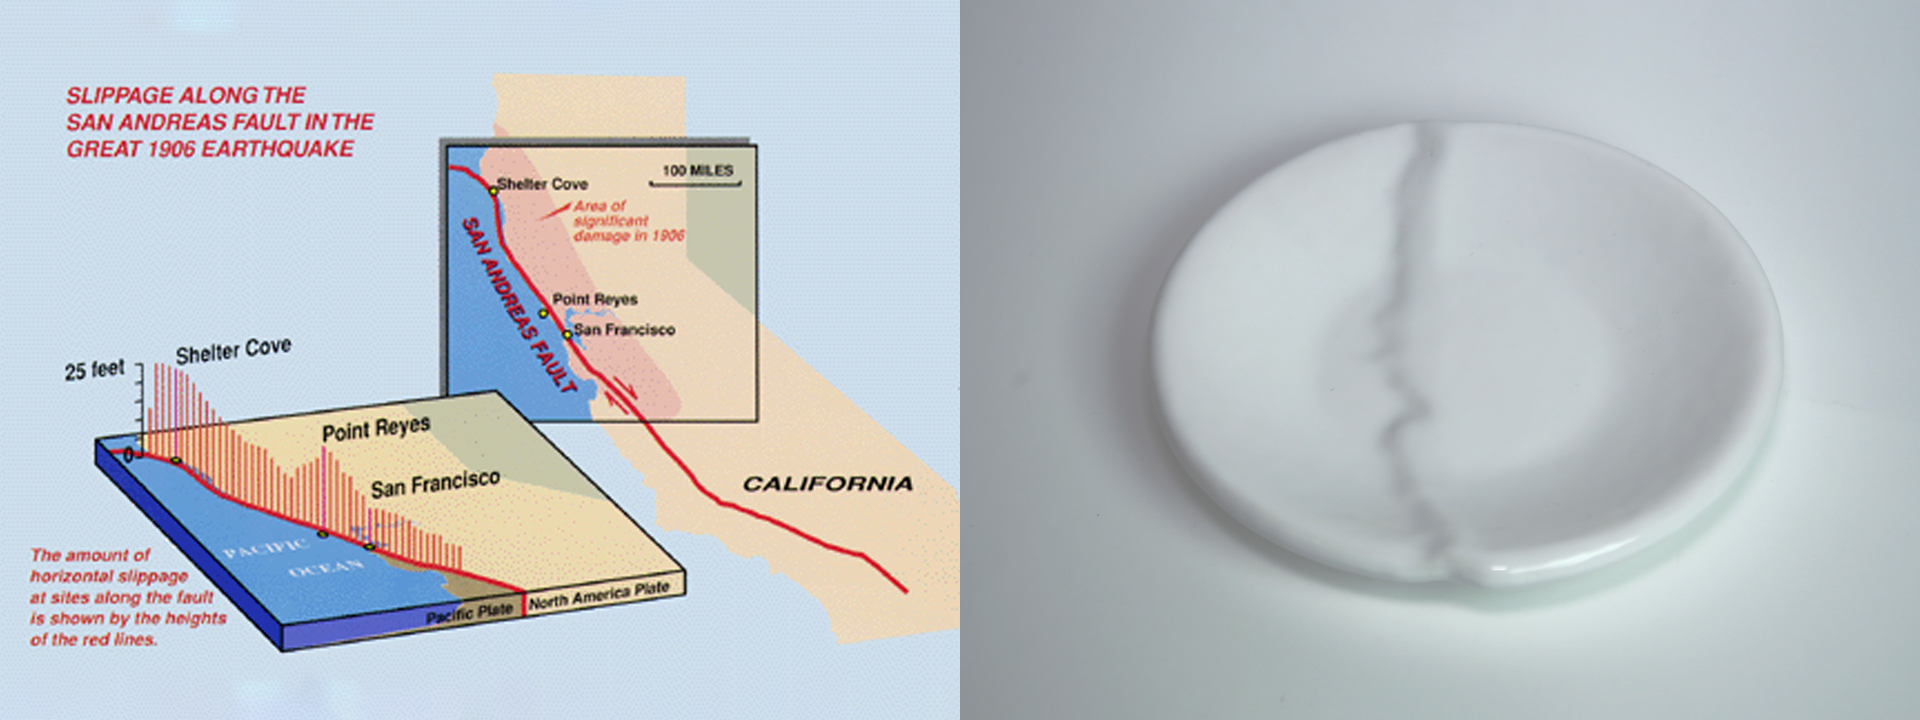
The plate has a crack down the center based on the slippage of the San Andreas Fault during The Great 1906 San Francisco Earthquake which killed thousands and devastated the San Francisco Chinatown. However, the event had the ironic effect of opening a new window for Chinese immigrants since the earthquake also destroyed the city birth and citizenship records.
Background
On April 18, 1906, an earthquake struck San Francisco with an estimated moment magnitude of 7.9 and became one of the worst and deadliest earthquakes in the history of the United States. City leaders at the time of the quake set the total death count at more than 400, however researchers now think that 3,000 or more people died. A significant contribution to this discrepancy is that few, if any, deaths were recorded in Chinatown, the city’s densest area with a population of about 14,000, which was completely destroyed–an omission largely driven by racist views of the Chinese who, at best, were not considered citizens and, at worst, considered “cancer in the heart of the city.”

Source: Chicago Daily News/Wikimedia Commons
The earthquake, however, had the unintended effect of opening a new immigration window for the Chinese in America. As fires destroyed much of the city, the birth and citizenship records were also destroyed. The loss of these documents allowed many Chinese immigrants to claim they were born in San Francisco rather than China, thus granting them U.S. citizenship. This opened the door for the purchase and sale of fraudulent documents which stated that Chinese immigrants were blood relatives to Chinese Americans who had citizenships in the United States. Recipients of these documents were referred to as Paper Sons.
Design
The USGS has data available for the rupture length and slip of the 1906 San Francisco earthquake. The data is composed of 48 points of the earthquake rupture spanning 296 miles (477 km) of the San Andreas Fault between San Juan Bautista and Cape Mendocino.

The slippage data was used to produce a crack along the center of the plate. “Slippage” is essentially the relative horizontal movement along the fault. During the Earthquake of 1906, the slip varied from 2 to 32 feet (0.5 to 9.7 meters). To visualize this, one can imagine standing face to face with a person on the opposite side of the fault and watching them slide horizontally 32 feet to your right.
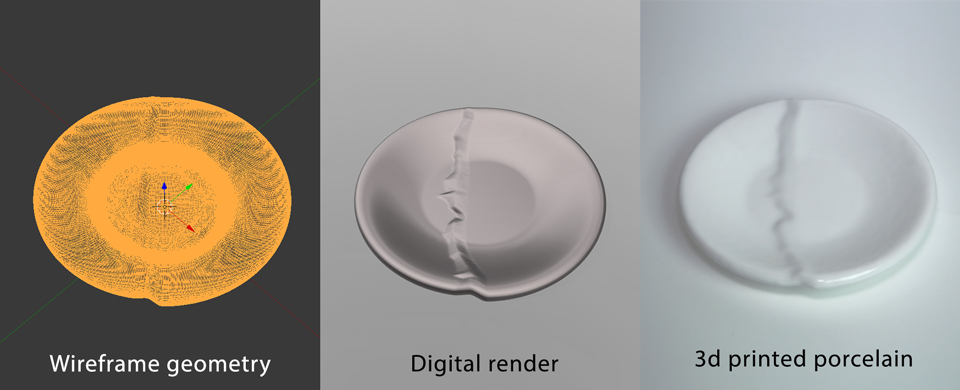
Each individual data point, represented in feet of horizontal movement, were used to offset one side of the plate, creating both a visual and tactile representation of the data.

The model
The model was generated algorithmically using free and open source software: Python and Blender. Python was used to generate the geometry and Blender was used for post-processing, viewing, and exporting into a printable 3d model.

You can view the source code and instructions for how this model was created. You can also view the model in your browser
View additional pieces: